How to Install Process Exporter on Kubernetes for Monitoring Linux Processes with VictoriaMetrics and Grafana
Process Exporter is an exporter used to monitor Linux system processes. In this article, the exporter will be exposed through a VictoriaMetrics endpoint. This tool is highly useful for observing the performance of applications and services without having to modify their source code.
As explained in its documentation:
"Some apps are impractical to instrument directly, either because you don't control the code or they're written in a language that isn't easy to instrument with Prometheus. We must instead resort to mining /proc."
Source: https://github.com/ncabatoff/process-exporter
This means that when an application is difficult to instrument directly—either because you don’t have access to its source code, or it’s written in a programming language that’s not easily integrated with VictoriaMetrics—you can use Process Exporter as an alternative solution.
With Process Exporter, you can extract metrics from the /proc directory in a Linux system. These metrics are then collected by VictoriaMetrics and visualized through Grafana, providing an interactive and insightful dashboard for system monitoring.
Steps:
- Apply daemonsets
ds-process-exporter.yaml
apiVersion: apps/v1
kind: DaemonSet
metadata:
  labels:
    app.kubernetes.io/component: processexporter
    app.kubernetes.io/name: process-exporter
  name: process-exporter
  namespace: monitoring-system
spec:
  selector:
    matchLabels:
      app: process-exporter
      app.kubernetes.io/component: processexporter
      app.kubernetes.io/name: process-exporter
  template:
    metadata:
      labels:
        app: process-exporter
        app.kubernetes.io/component: processexporter
        app.kubernetes.io/name: process-exporter
      annotations:
        prometheus.io/scrape: "true"
        prometheus.io/port: "9256"
        prometheus.io/path: "/metrics"
        prometheus.io/scheme: "http"
    spec:
      containers:
        - name: process-exporter
          image: ncabatoff/process-exporter:latest
          args:
            - "--procfs=/host/proc"
            - "--config.path=/etc/process-exporter/process-exporter.yaml"
          ports:
            - name: metrics
              containerPort: 9256
          resources:
            limits:
              cpu: 250m
              memory: 200Mi
            requests:
              cpu: 100m
              memory: 100Mi
          securityContext:
            runAsGroup: 65532
            runAsNonRoot: true
            runAsUser: 65532

          volumeMounts:
          - name: proc
            mountPath: /host/proc
            readOnly: true
          - name: config-volume
            mountPath: /etc/process-exporter/process-exporter.yaml
            subPath: process-exporter.yaml
      volumes:
      - name: proc
        hostPath:
          path: /proc
      - name: config-volume
        configMap:
          name: process-exporter-config
- Then apply the ConfigMap:
cp-process-exporter.yaml
apiVersion: v1
data:
  process-exporter.yaml: |-
    process_names:
      - name: "{{.Comm}}"
        cmdline:
        - '.+'
kind: ConfigMap
metadata:
  name: process-exporter-config
  namespace: monitoring-system
- Apply services
svc-process-exporter.yaml
apiVersion: v1
kind: Service
metadata:
  name: process-exporter
  namespace: monitoring-system
  labels:
    app.kubernetes.io/component: processexporter
    app.kubernetes.io/name: process-exporter
spec:
  selector:
    app: process-exporter
    app.kubernetes.io/component: processexporter
    app.kubernetes.io/name: process-exporter
  type: NodePort
  ports:
    - name: metrics
      port: 9256
      targetPort: 9256
      nodePort: 30500
- Apply service-scrape
vmservicescrape.yaml
apiVersion: operator.victoriametrics.com/v1beta1
kind: VMServiceScrape
metadata:
  name: process-exporter
  namespace: monitoring-system
  labels:
    app.kubernetes.io/component: processexporter
    app.kubernetes.io/name: process-exporter
spec:
  selector:
    matchLabels:
      app.kubernetes.io/name: process-exporter
      app.kubernetes.io/component: processexporter
  namespaceSelector:
    matchNames:
      - monitoring-system
  endpoints:
    - port: metrics
      interval: 30s
      path: /metrics
      scheme: http
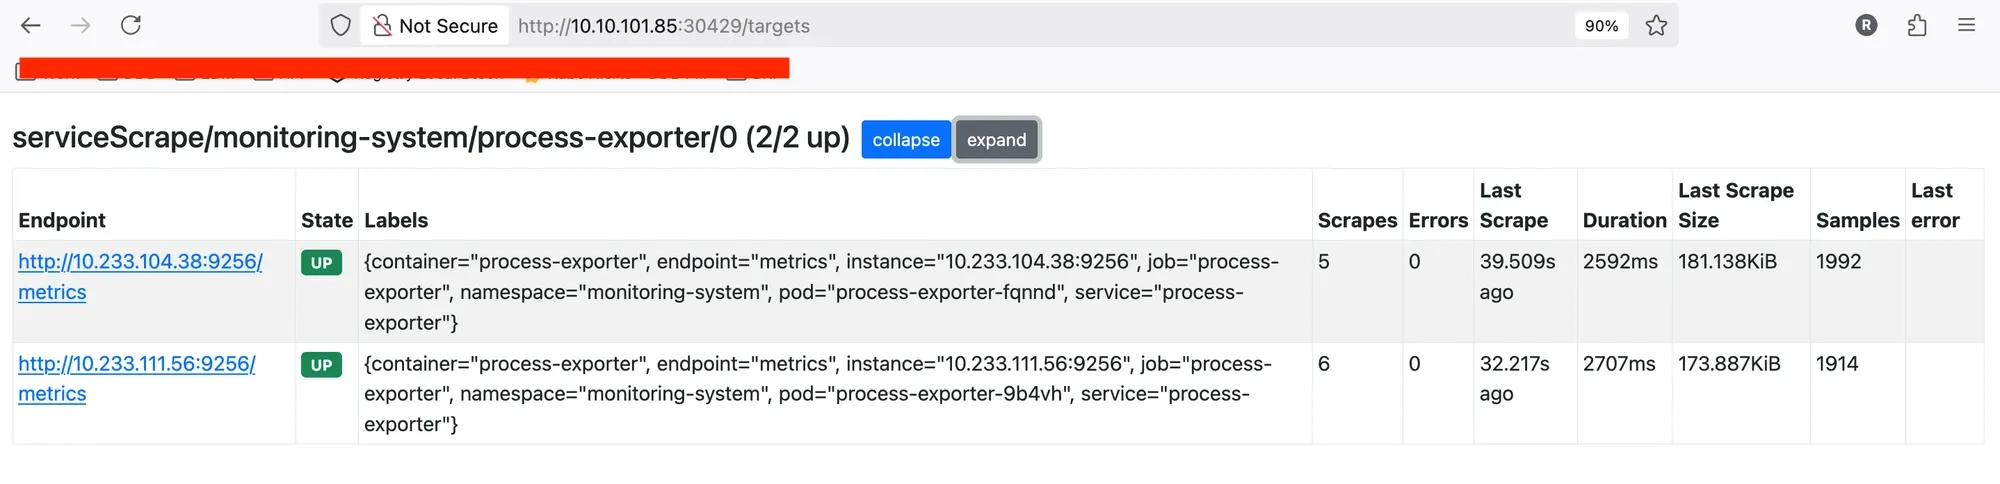
Result:
Check on vmagent VictoriaMetrics
Import Dashboard Grafana: https://grafana.net/dashboards/249
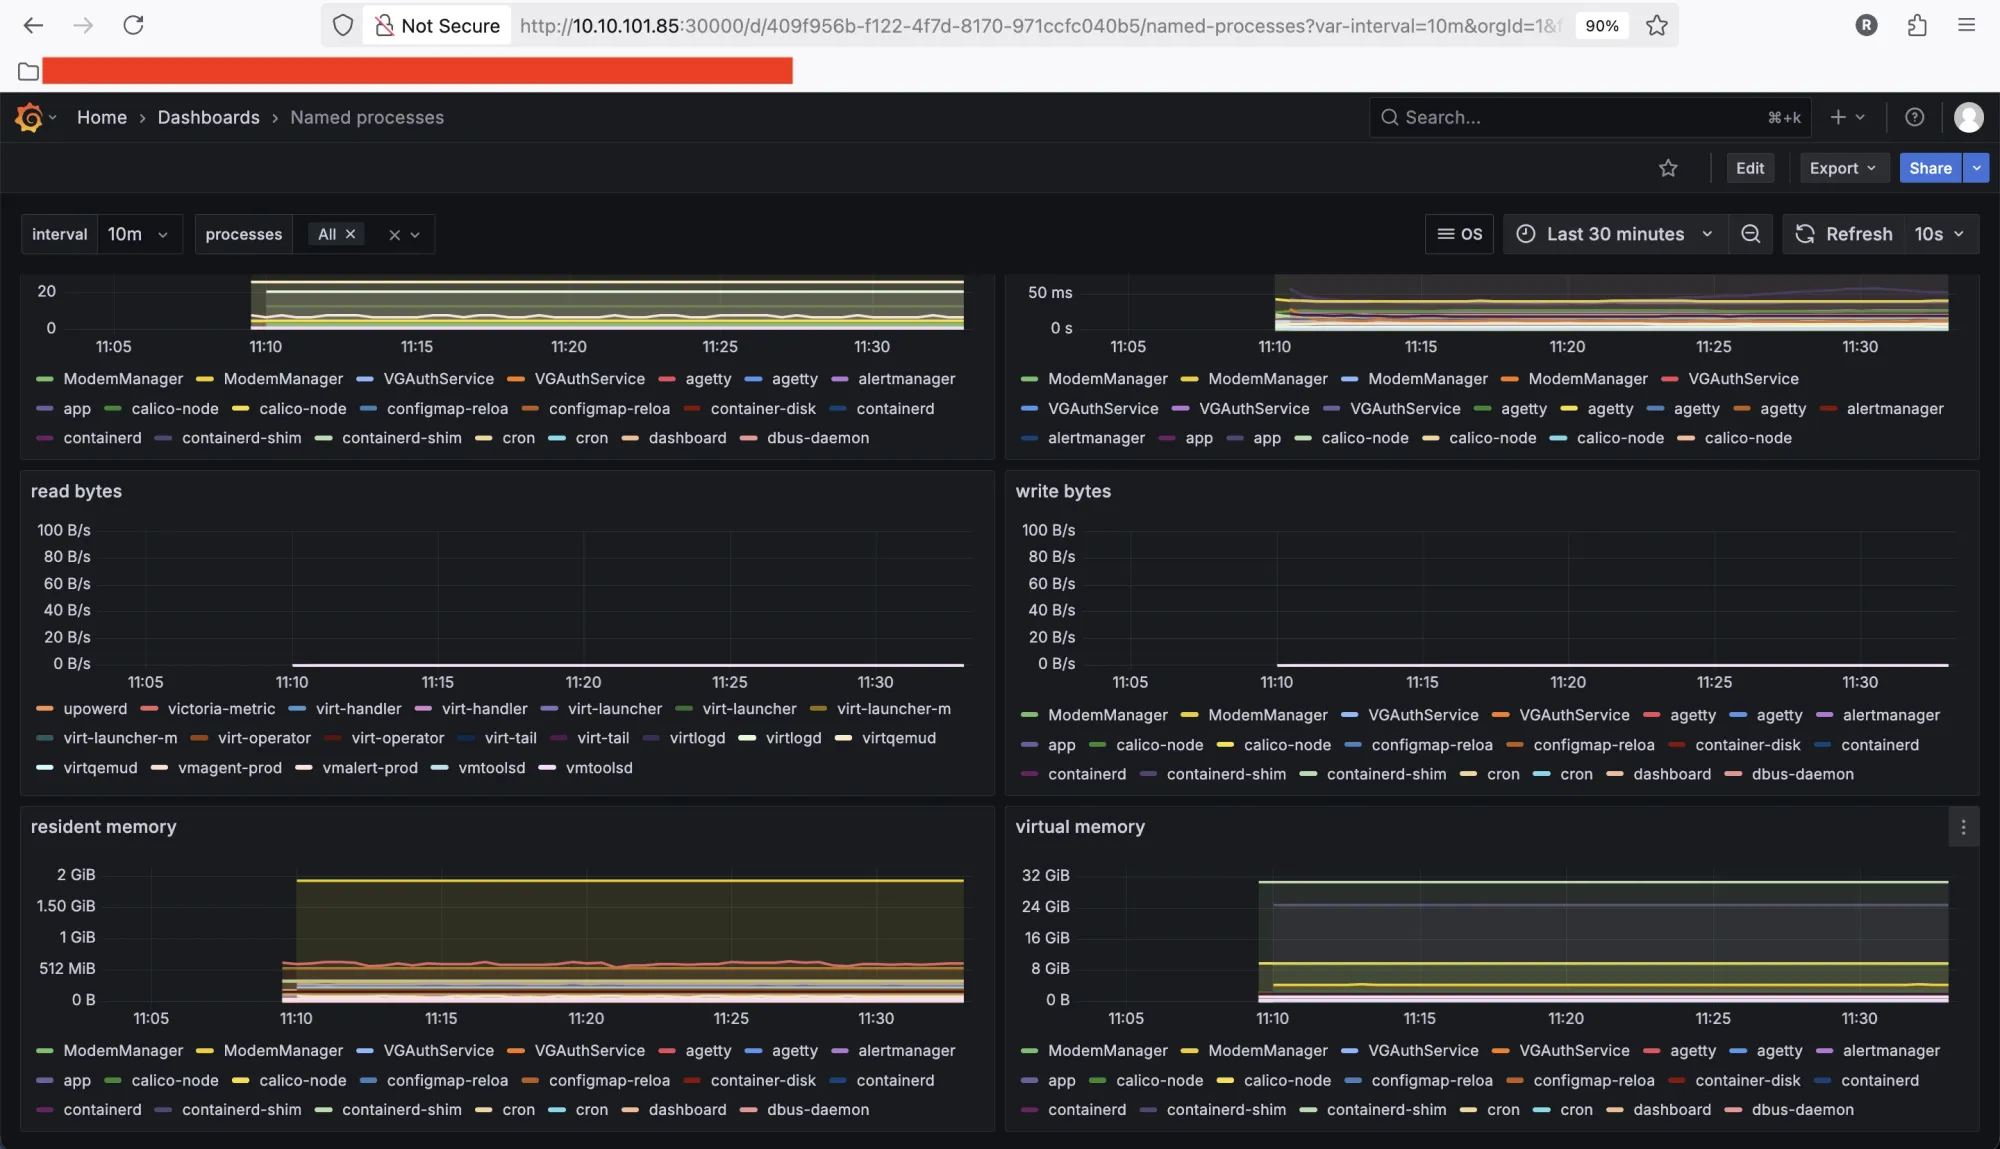
By deploying Process Exporter as a DaemonSet, each node in your Kubernetes cluster will run its own exporter instance. This ensures that all system processes on every node are centrally monitored through VictoriaMetrics (or Prometheus), enabling efficient process-level monitoring across the cluster.